Popular information
Popular science background:
Trendspotting in asset markets (pdf)
Populärvetenskaplig information:
Trendspaning på finansmarknaden (pdf)
The Prize in Economic Sciences 2013
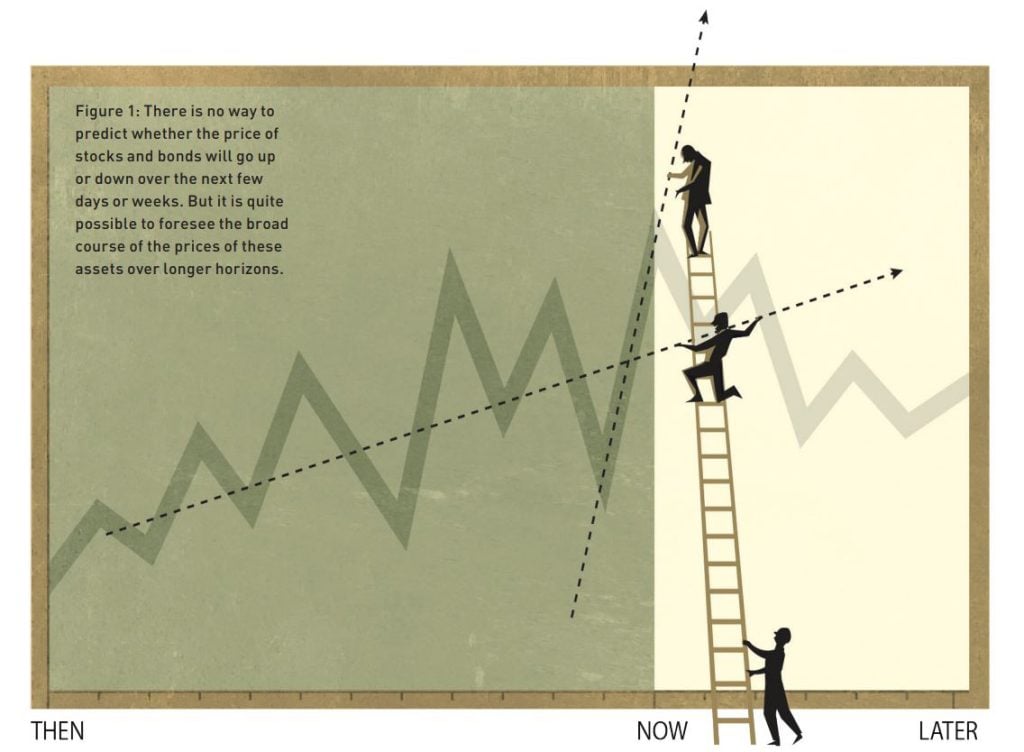
There is no way to predict whether the price of stocks and bonds will go up or down over the next few days or weeks. But it is quite possible to foresee the broad course of the prices of these assets over longer time periods, such as, the next three to five years. These findings, which may seem both surprising and contradictory, were made and analyzed by this year’s Laureates, Eugene Fama, Lars Peter Hansen and Robert Shiller.
Trendspotting in asset markets
Fama, Hansen, and Shiller have developed new methods for studying asset prices and used them in their investigations of detailed data on the prices of stocks, bonds and other assets. Their methods have become standard tools in academic research, and their insights provide guidance for the development of theory as well as for professional investment practice. Although we do not yet fully understand how asset prices are determined, the research of the Laureates has revealed a number of important regularities that are helping us to arrive at better explanations.
The behavior of asset prices is essential for many important decisions, not only for professional investors but also for most people in their daily life. The choice on how to save – in the form of cash, bank deposits or stocks, or perhaps a single-family house – depends on what one thinks of the risks and returns associated with these different forms of saving. Asset prices are also of fundamental importance for the macroeconomy, as they provide crucial information for key economic decisions regarding consumption and investments in physical capital, such as buildings and machinery. While asset prices often seem to reflect fundamental values quite well, history provides striking examples to the contrary, in events commonly labeled as bubbles and crashes. Mispricing of assets may contribute to financial crises and, as the recent global recession illustrates, such crises can damage the overall economy. Today, the field of empirical asset pricing is one of the largest and most active subfields in economics.
Predictability …
The predictability of asset prices is closely related to how markets function, and that’s why researchers are so interested in this question. If markets work well, prices should have very little predictability. This statement may seem paradoxical, but consider the following: suppose investors could predict that a certain stock would increase a lot in value over the next year. Then they would buy the stock immediately, driving up the price until it is so high that the stock is no longer attractive to buy. What remains is an unpredictable price pattern, with random movements that reflect the arrival of news. In technical jargon, prices then follow a “random walk.”
There are, however, reasons why prices may follow somewhat predictable patterns even in a well-functioning market. A key factor is risk. Risky assets are less attractive to investors, so on average, a risky asset will need to deliver a higher return. A higher return for the risky asset means that its price can be predicted to rise faster than for safe assets. To detect market malfunctioning, then, one would need to have an idea of what a reasonable compensation for risk ought to be. The issue of predictability and the issue of normal returns that compensate for risk are intertwined. The three Laureates have shown how to disentangle these issues and analyze them empirically.
… is absent in the short run …
There are several ways to approach predictability. One way is to investigate whether asset prices over the past few days or weeks can be used to predict tomorrow’s price. The answer is no. Following a large amount of careful statistical work by Fama in the 1960s, researchers now agree that past prices are of very little use in predicting returns over the immediate future.
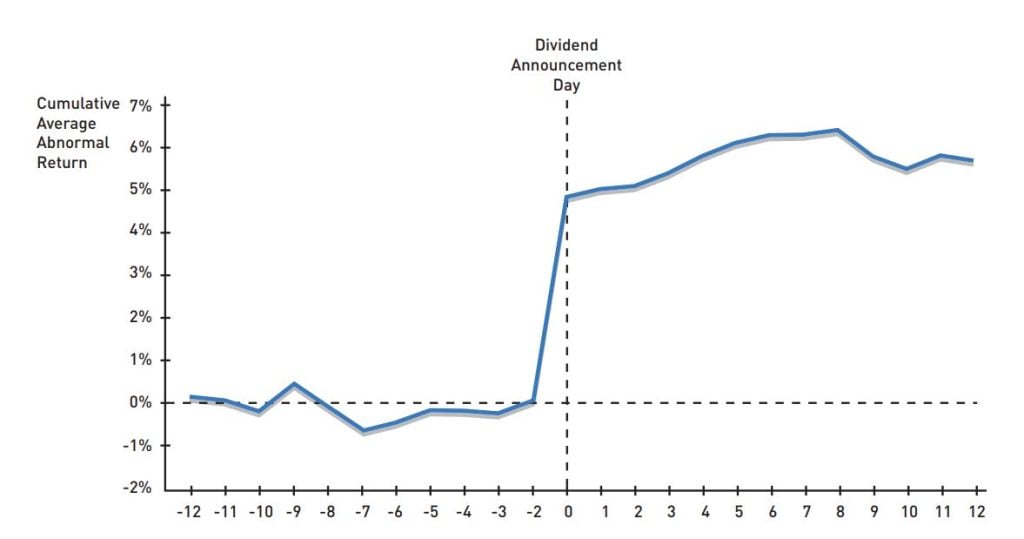
Another way is to examine how prices react to information. In a seminal study, Fama, Fisher, Jensen and Roll (1969) investigated stock price movements after news about stock splits. To their surprise, they found that the market seemed to incorporate information very swiftly. If the price of the firm’s stock had reacted only slowly and sluggishly to the news, the price path would have been predictable. But the researchers found no such pattern. Their study was quickly followed by a large number of others, investigating different types of events, and confirming the original findings: after the initial reaction to a news event, a stock price is extremely hard to predict.
… but there is predictability in the long run
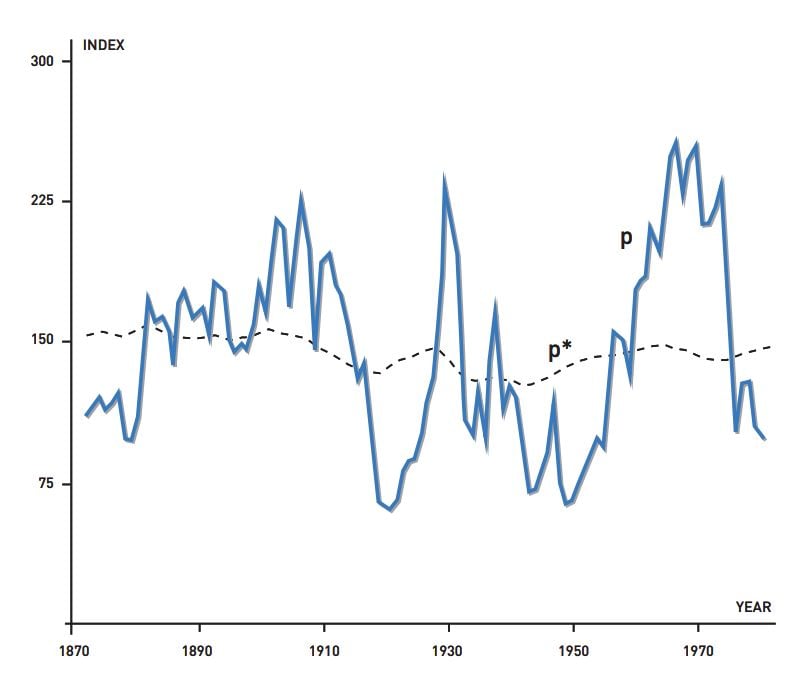
If stock prices are next to impossible to predict over the course of days or weeks, shouldn’t they be even harder to predict over longer time horizons? One may believe so, but empirical research by Shiller showed this conjecture to be incorrect. His studies of stock-price volatility and longer-term predictability provided the key insights. First, Shiller (1981) demonstrated that stock prices move much more than can be explained by dividend streams. Basic theory says that a stock’s value should equal the expected value of future dividends, so the price volatility that he observed appeared excessive.
An implication of the excessive swings in stock prices is that a high ratio of price relative to dividends in one year will tend to be followed by a fall in prices relative to dividends over subsequent years, and vice versa. This means that returns follow a predictable pattern in the longer run. Shiller and his collaborators demonstrated such predictability in stock markets as well as bond markets, and other researchers have later confirmed this finding in many other markets.
Rational-investor model interpretations
How should longer-run predictability of asset returns be interpreted? One way to approach this question is to build on standard theory, which says that investors rationally calculate what assets are worth. Thus, an asset’s value should be based on the payment stream that it is expected to generate in the future. A reasonable assumption is that these payments are discounted: in other words, payments in the distant future carry less weight than more immediate payments. For Shiller’s original study, he assumed a constant discount factor, and he concluded that reconciling the excess price fluctuations with theory is very difficult. However, discounting could possibly vary over time. If so, even rather stable dividend streams might cause stock prices to vary a lot. But why would discounting vary over time? And why would it vary in such a way that it could account for such large price fluctuations?
Answering these questions requires a theoretical model that connects asset prices to the savings and risk-taking decisions made by rational individuals. The most basic and well-known model is the so-called Consumption Capital Asset Pricing Model (CCAPM), developed in the 1970s by several researchers. While well-established theoretically, that model was difficult to test for many years. In 1982, Hansen presented a statistical method, the Generalized Method of Moments (GMM), that was particularly suited for dealing with the peculiar properties of asset-price data. Hansen then used GMM to test whether historical stock-price data were consistent with the standard form of CCAPM. He found that the model must be rejected because it could not explain the data. This confirmed Shiller’s preliminary findings: asset prices fluctuate too much, even when allowing for time-varying discount rates that follow from the CCAPM.
The failure of the basic form of the CCAPM, which was also confirmed by many other researchers, inspired waves of new theory and new empirical work. One strand of research aims to improve the measures of risk and attitudes towards risk. This literature develops theoretical extensions of the CCAPM, focusing on how investors in bad times may be much more sensitive to risk than in the basic model. This mix of new theory and GMM-based empirical testing has been very influential beyond asset-pricing research, and it has generated many new insights about human behavior more broadly.
Behavioral model interpretations
Another way to interpret longer-term predictability is to abandon the notion of fully rational investors. Moving beyond this assumption has opened up a new field referred to as “behavioral finance.” Here, mistaken expectations are at center stage: high asset prices may reflect overestimates of future payment streams. In other words, excessive optimism or other psychological mechanisms may help to explain why asset prices deviate from fundamental values.
A main challenge for the behavioral approach has been how to explain why more rational investors do not eliminate the excessive price swings by betting against less rational investors. A common answer is that rational investors may face various institutional limits, such as credit constraints, that prevent them from going against the market on a sufficiently large scale.
As a result, the new behavioral approach focuses on institutional constraints and conflicts of interest, while the new rational approach focuses on risk and attitudes to risk. Each of these approaches has added important insights. Together they go a significant way towards explaining volatility and longer-term predictability in asset markets.
The cross-section of asset returns
The empirical research discussed so far explores differences in overall asset returns over time. An important related question concerns differences in returns across assets. Put succinctly: does stockpicking pay? If so, what factors should an investor use to pick stocks? The classical Capital Asset Pricing Model (CAPM) provides a framework for assessing differences in returns across different stocks. CAPM predicts that stocks that have high returns when the overall market return is high should yield, on average, a relatively high return as a compensation for risk. Similarly, stocks with high returns when the overall market return is low should yield relatively low returns on average. Such stocks can be used as hedges, and are therefore desirable for the risk-averse investor even if they do not yield a high average return.
Fama developed methods for testing whether a stock’s correlation with the market is indeed a key predictor for its future return. He and other researchers found that it was not because other factors were much more important in predicting returns. In particular, a stock’s “size” (total market value of a company), and “book-to-market ratio” (book value as a fraction of the market value) have a large explanatory power: large firms, or firms with low book-to-market values, have low subsequent returns on average. This finding is akin to Shiller’s finding on longer-term predictability. Just as a low general valuation of stocks in relation to dividends predicts high future returns, so-called value stocks (with a high book-to-market ratio) tend to yield high returns relative to stocks with a low book-to-market value.
Why do these extra factors help explain stock prices, contrary to the standard, one-factor CAPM? Again, some explanations are based on rational investor behavior, while others explore behavioral models. Thanks to the intensive research in this area by Fama and others, the cross-section properties of asset prices are much better understood today than three decades ago.
Impacts on investment practice…
The work of the Laureates has affected not only academic research but also market practice. The fact that stock markets are very hard to predict in the short run, and that stock-picking is very difficult both in the short and the long run, has led to close examination of the performance by mutual funds. Research generally has failed to find that mutual funds generate positive returns above what can be motivated by the level of risk; once fund fees are taken into account, their asset management often yields negative excess returns. The recent growth of index funds, which collect all stocks in passively managed portfolios, follows that insight. Moreover, the few successful specialized funds we observe are often motivated by the new factors – “size” and “book-to-market” – that are included in the extended version of the CAPM.
Event studies not only give information about predictability (or lack thereof) but also provide estimates of how the market evaluates actions such as stock-market splits, stock issues, or takeover bids. This information is valuable for performance evaluation and for companies that might consider whether or not to take such actions.
The behavioral approach also has had direct impacts on practice. Shiller suggested early on that important risks facing investors are sometimes hard to measure and thus are non-insurable by existing market instruments. The Case-Shiller housing price index was constructed to aid investors in gauging trends and movements in housing prices and in constructing assets to insure against price fluctuations.
… and on research
The findings on predictability are striking and continue to generate large amounts of follow-up research characterized by a fruitful interplay between empirical work and theory development. The interest in finance and asset pricing is largely driven by fundamental questions: to what extent is market volatility a sign that markets do not work all that well, and what policy measures can be taken to limit any adverse outcomes? The early findings – the difficulty in predicting prices in the short run and the precise and rapid price responses in the event studies – indicated that at least a basic condition for market efficiency was satisfied. But the subsequent longer-term predictability findings have certainly changed the prior beliefs of many researchers. It is too early to say to what extent predictability reflects natural swings in the amount and (rational) perception of risks and to what extent it reflects mispricing. Understanding how mispricing of assets emerges, and when and why financial markets do not efficiently reflect available information, is one of the most important tasks for future research. The answers may turn out to depend heavily on the particular contexts and institutional settings, but they will no doubt be extremely valuable for policymakers as well as practitioners.
Links and further reading
Eugene Fama
Interview with Eugene Fama by Richard Roll at the web page of American Finance Association: http://www.afajof.org/details/video/2870921/Eugene-Fama-Interview.html
Fama, E.F. (2011), “My life in finance”, Annual Review of Financial Economics 3, 1-15.
Fama, E.F. (1970), “Efficient capital markets: a review of theory and empirical work”, Journal of Finance 25, 383-417.
Fama, E.F. (1991), “Efficient capital markets II,” Journal of Finance 46, 1575-1618.
Lars-Peter Hansen
Ghysels, E., A. Hall and L.P. Hansen (2002), “Interview with Lars Peter Hansen”, Journal of Business &
Economic Statistics 20 442-447.
Lars Peter Hansen (2008), “Generalized method of moments estimation”, in S.N.Durlauf and L.E.
Blume (eds.), The New Palgrave Dictionary of Economics, Second Edition.
Robert Shiller
Campbell, J.Y. and R.J. Shiller (2007), “Robert Shiller interviewed by John Campbell”, ch. 11 in P.A. Samuelson and W.A. Barnett, Inside the Economist’s Mind: Conversations with Eminent Economists, Blackwell/Wiley.
Shiller, R.J. (2000), Irrational Exuberance, Princeton University Press.
The Laureates
EUGENE F. FAMA
U.S. citizen. Born 1939 in Boston, MA, USA. Ph.D. 1964 from University of Chicago, IL, USA.
Robert R. McCormick Distinguished Service Professor of Finance at University of Chicago, IL, USA.
www.chicagobooth.edu/faculty/directory/f/eugene-f-fama
LARS PETER HANSEN
U.S. citizen. Born 1952 in Urbana, IL, USA. Ph.D. 1978 from University of Minnesota, Minneapolis, MN, USA.
David Rockefeller Distinguished Service Professor in Economics & Statistics at University of Chicago, IL, USA.
http://larspeterhansen.org
ROBERT J. SHILLER
U.S. citizen. Born 1946 in Detroit, MI, USA. Ph.D. 1972 from Massachusetts Institute of Technology (MIT), Boston, MA, USA.
Sterling Professor of Economics at Yale University, New Haven, CT, USA.
www.econ.yale.edu/~shiller